Wccftech's Hassan Mujtaba published a 15-GPU performance test for Phantom Blade Zero on October 27. Three days later, Chinese outlet Kuaikeji (快科技) ran a single Gigabyte RTX 5080 MASTER 16GB through 24 separate results — three resolutions, two upscaling settings, four ray-tracing states. Read together, the two pieces answer the question PC players keep asking: how many frames will my card actually produce in this game.
The short answer first. At native 4K, exactly one of the fifteen cards clears 60 fps: the RTX 5090 at 63. Everything else lands below the line. At native 1440p the first card past 60 is the RTX 5070 Ti at 62. At native 1080p the first card past 60 is the RX 9070 XT at 67, with the RTX 5070 and RTX 4070 Ti SUPER stopping at 55 and 56.
One caveat has to be settled before any of those numbers are compared. The two outlets do not mean the same thing by "native." Wccftech switched every upscaler off. Kuaikeji's baseline uses DLAA, which is DLSS running at native resolution and therefore still inside the upscaling pipeline. That is why the same RTX 5080 appears at 40 fps in one piece and 56 fps in the other. The gap is a methodology difference, not a disagreement between two measurements.
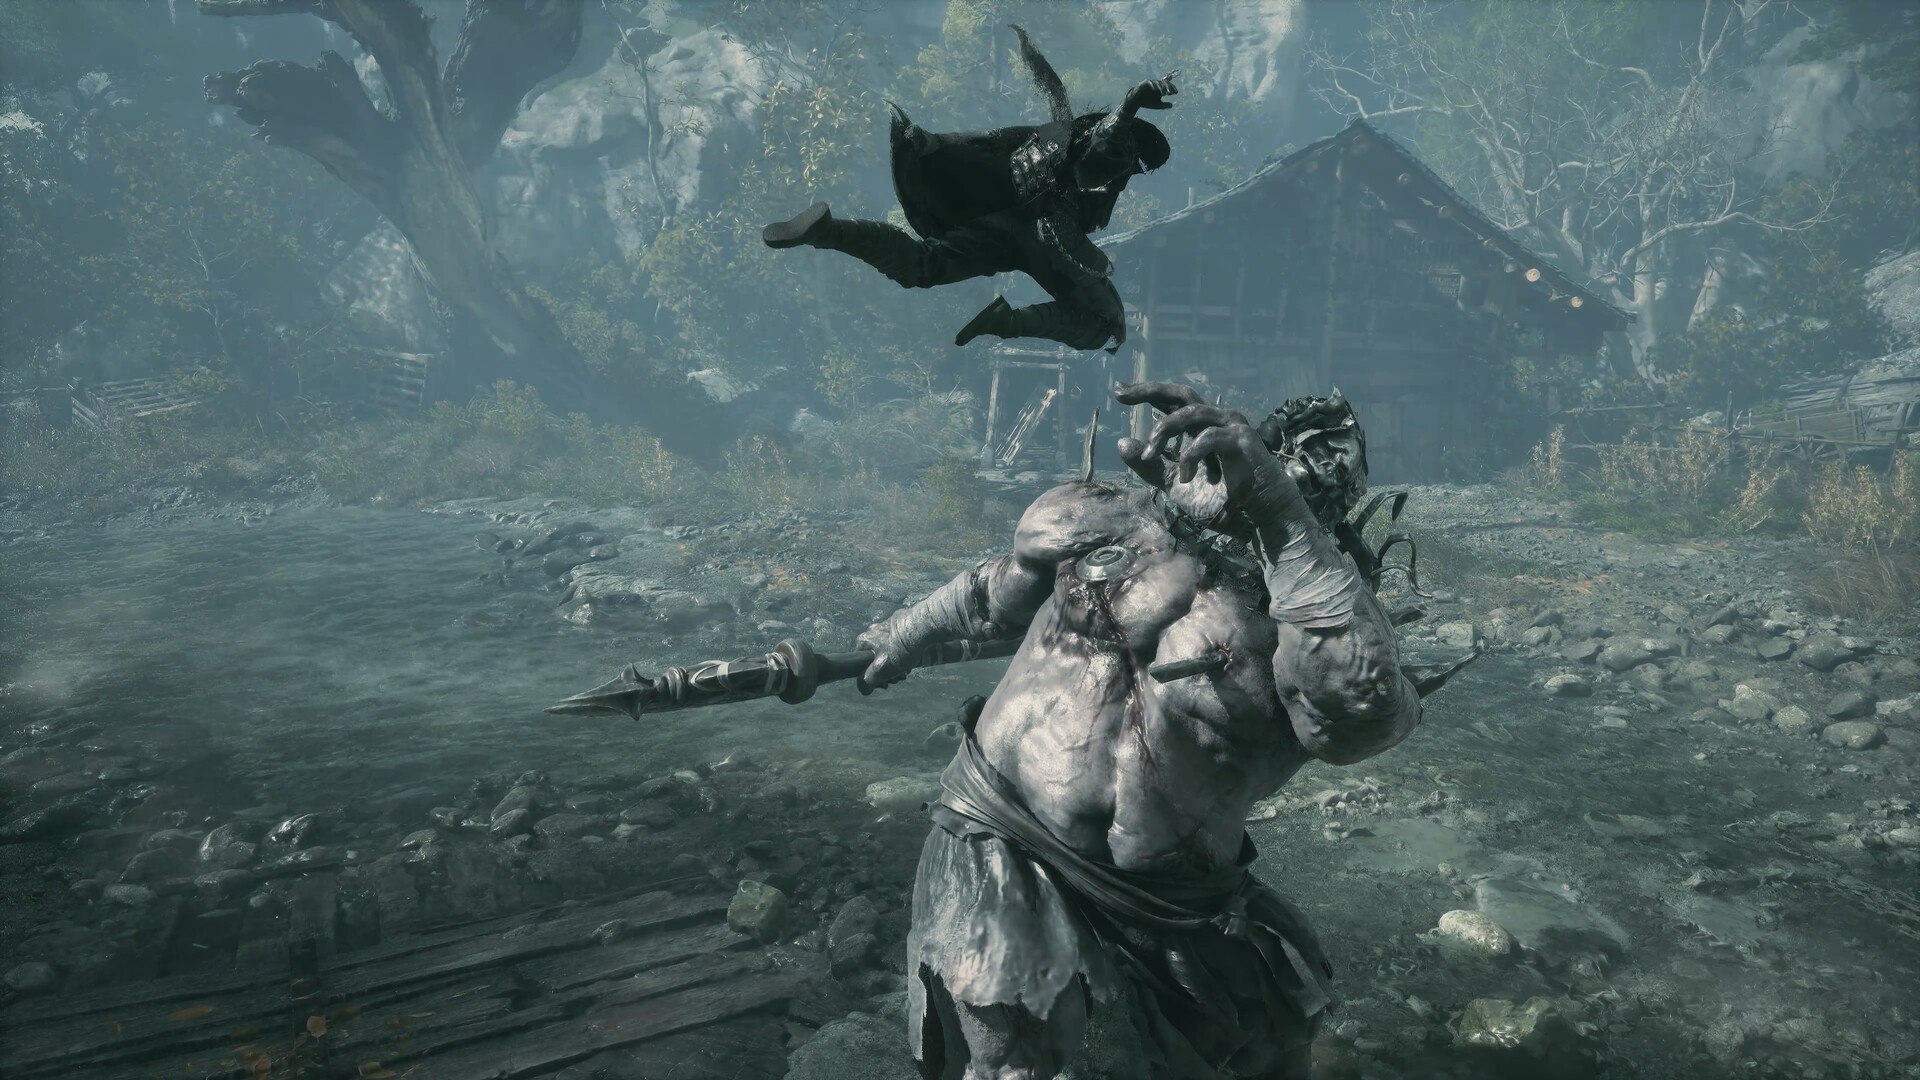
Native Frame Rates: 15 GPUs Across Three Resolutions
Wccftech's test bench was a Core i9-13900K on an MSI MEG Z790 ACE with 32GB of DDR5-7600, the Ultra preset, and both upscaling and frame generation disabled. All three columns below come from that one platform and one scene.
| GPU | Native 4K | Native 1440p | Native 1080p |
|---|---|---|---|
| RTX 5090 | 63 | 100 | 122 |
| RTX 4090 | 51 | 84 | 104 |
| RTX 5080 | 40 | 72 | 86 |
| RTX 4080 SUPER | 36 | 65 | 78 |
| RTX 5070 Ti | 34 | 62 | 75 |
| RX 9070 XT | 31 | 57 | 67 |
| RTX 4070 Ti SUPER | 26 | 48 | 56 |
| RTX 5070 | 25 | 47 | 55 |
| RTX 4070 | 18 | 42 | 41 |
| RX 9060 XT 16GB | 15 | 35 | 33 |
| RTX 5060 Ti 16GB | 15 | 34 | 33 |
| RTX 4060 Ti 16GB | 13 | 32 | 31 |
| RTX 5060 8GB | 11 | 31 | 30 |
| RTX 4060 8GB | 7 | 22 | 23 |
| Arc B580 | 5 | 20 | 22 |
Read the three columns side by side and two shapes appear that run against intuition. The first is that the spread between high-end cards shrinks as resolution drops. The 4K column falls from 63 fps to 7, a span of roughly nine times. The 1080p column falls from 122 to 23, a span of a little over five times. The RTX 5090 leads the RTX 4090 by 12 frames at 4K; at 1080p the gap is 18 frames, which is already close to a sixth of what the 4090 itself produces. Frame rate in that column no longer scales linearly with the card.
The second shape is that the steps between neighbouring cards are uneven. At 4K, going from the 5090 to the 4090 costs 19%, from the 4090 to the 5080 costs 22%, from the 5080 to the 4080 SUPER costs only 10%, and from the 4080 SUPER to the 5070 Ti costs 6%. The steep drops sit in the middle of the stack: 5070 Ti to RX 9070 XT loses 9%, RX 9070 XT to 4070 Ti SUPER loses 16%, and 4060 Ti to 5060 8GB loses another 15%.
Where the 60 fps Line Actually Falls
Wccftech states it plainly: at 4K there are hardly any GPUs besides the RTX 5090 that can handle 60+ fps, and every other card runs below 60, which makes Phantom Blade Zero a graphics-intensive title.
The 1440p tier carries one inconsistency worth flagging. The prose says 60 fps can be reached on cards such as the RTX 5070 Ti, the RX 9070 XT and above, but the chart in the same article records the RX 9070 XT at 57. Counting from the chart, the first card past the line at 1440p is the RTX 5070 Ti at 62; counting from the prose, the RX 9070 XT is included as well. The two readings differ by three frames, and what follows uses the chart.
1080p is looser but the same care applies. The first card past 60 in the chart is the RX 9070 XT at 67, while the RTX 4070 Ti SUPER at 56 and the RTX 5070 at 55 both stay just short. Wccftech's own framing for that tier is that entry-level and mainstream GPUs need lower quality settings plus upscaling to reach 60+ fps.
The Cost of Ray Tracing and Path Tracing: Two Different Ratios
This is the part of the two articles that must not be blended.
Wccftech's method stacks switches on top of each other at 4K, Ultra preset, RTX 5090. Turning on ray tracing costs 20% to 22% against native Ultra. Adding path tracing on top of ray tracing costs a further 35% to 40%, and the two together land roughly 50% below native Ultra. The article also notes that these figures come from 4K on a 5090, and that other resolutions or cards will differ.
Kuaikeji's method runs one RTX 5080 across all three resolutions and concludes that ray tracing costs about 10% of frame rate, that path tracing costs roughly twice what ray tracing does, and that switching upscaling to Balanced recovers about half of the ray-tracing loss.
Twenty to 22 percent and about 10 percent are not conflicting data points. They are two different measurements: different GPU, different scene, different upscaling state. They cannot be added together and they cannot be averaged. What does line up is direction — path tracing costs substantially more than ray tracing, and both outlets agree on that.
One RTX 5080 Across Every Setting: 41 fps to 311 fps
The value of Kuaikeji's dataset is completeness. One card, one scene, three resolutions, two upscaling settings, and four states recorded for each — default, ray tracing, path tracing, and path tracing with 6x frame generation. Twenty-four results in total.
| Resolution and upscaling | Default | Ray tracing | Path tracing | Path tracing + 6x frame-gen |
|---|---|---|---|---|
| 4K + DLAA | 56 | 51 | 41 | 194 |
| 4K + Balanced | 92 | 87 | 75 | 311 |
| 1440p + DLAA | 82 | 73 | 64 | 304 |
| 1440p + Balanced | 120 | 113 | 102 | 429 |
| 1080p + DLAA | 105 | 97 | 87 | 377 |
| 1080p + Balanced | 141 | 132 | 124 | 544 |
Read the table vertically and the most useful row is 4K with Balanced upscaling: 92 fps by default, 87 with ray tracing, and still 75 with path tracing on. On this card, 4K path tracing clears 60 fps without frame generation at all. Read it horizontally and the scale of frame generation becomes visible: 4K with DLAA climbs from 41 fps under path tracing to 194, which the article labels a 373% gain, while 1440p with Balanced climbs from 102 to 429 for a stated 320%.
Kuaikeji summarises the Balanced-upscaling gain as "about 50%." Recomputing from its own table gives 4K rising from 56 to 92 (+64%), 1440p from 82 to 120 (+46%), and 1080p from 105 to 141 (+34%) — an actual spread of 34% to 64%, with the return growing as resolution rises.
How Much the Presets Themselves Cost
Wccftech separately measured preset scaling at 4K on the RTX 5090: Low 103 fps, Medium 99, High 85, Very High 72, Ultra 67.
Its explanation for that sequence is that Low and Medium look very similar — mostly a texture-quality difference plus a little vegetation, with lighting identical between the two — so they sit only 3 to 5 frames apart. High is the first real upgrade, filling in lighting, textures and meshes at a cost of 14%. Very High drops another 15%. Ultra looks only slightly better than Very High and costs a further 6% to 7%.
Those percentages say one thing clearly: High to Very High is the second-largest step in the ladder after Medium to High, while Ultra against Very High costs only 6% to 7%. The most expensive jump in the four presets is not the last one.
Entry-Level Cards and Older GPUs: Single Digits at 4K
Pull the three lowest-positioned cards out of the table and look at them alone. The RTX 5060 8GB records 11 fps at native 4K, the RTX 4060 8GB records 7, and Intel's Arc B580 records 5. Only at 1440p and 1080p do they return to the 20-to-31 band, where the RTX 5060 8GB reaches 30 at 1080p.
Those three cards also show the widest gap between 4K and 1080p: the RTX 5060 8GB nearly triples from 11 to 30 frames, while the RTX 5090 less than doubles from 63 to 122. Low-end cards are far more sensitive to resolution, and the table makes that plain.
One line from Kuaikeji is worth setting beside this. It argues that even the entry RTX 5060 8GB in the RTX 50 series can turn ray tracing on in this game, while the path-tracing tier in its own test was handled by a 16GB RTX 5080 with resolution raised to 4K at the same time. That is a conclusion about its own 5080 test, and it should not be read as a hardware threshold saying 8GB cards cannot run path tracing.
Settings That Change How the Numbers Read
Kuaikeji walked the settings menu item by item before testing, and a few of those entries directly affect how the frame rates above should be interpreted.
In fullscreen and borderless window modes the game locks render resolution to the desktop resolution and will not let it be lowered inside the game; anyone trading resolution for frames has to change the desktop resolution first. Windowed mode, by contrast, offers multiple steps between 720p and 4K.
Upscaling is offered as DLSS, FSR, XeSS and TSR, with five DLSS steps running from DLAA down to Ultra Performance. A separate "super resolution output resolution" option scales the image a second time after upscaling in exchange for performance, at the cost of softer, less sharp output, and it has no direct off switch — Kuaikeji used the automatic setting while testing.
Dynamic resolution automatically shifts the upscaling step when frame rate falls below target. On a stronger card running with V-Sync or a frame cap, turning it on can reduce fluctuation and improve the 1% low.
Ray tracing has only three states: off, ray tracing, and path tracing, with no finer levels. Ray reconstruction can be toggled manually once ray tracing is on, but it is forced on when path tracing is selected. Frame generation supports up to 6x, with a dynamic option that lets the game pick the multiplier, and NVIDIA Reflex is there to cut input latency.
Wccftech adds two more: the game runs on Unreal Engine 5.7.4, and the first launch includes a long one-time shader compilation that does not repeat afterwards. Path tracing is off by default and has to be chosen manually among native rendering, ray tracing and path tracing.
The four official spec tiers are a separate document from these measurements — what will start and what the publisher calls recommended, as covered in our PC system requirements breakdown. Nothing in that table predicts the frame rates above.
The order of use is: find your resolution's column, check whether the native figure clears 60, and if it does not, look at where the same card sits with Balanced upscaling — the RTX 5080 row suggests a gain somewhere between a third and two thirds — then subtract for ray tracing or path tracing using the ratios above. The two sources differ in GPU, scene and upscaling definition, so any figure estimated this way is a reference range rather than a measured value.